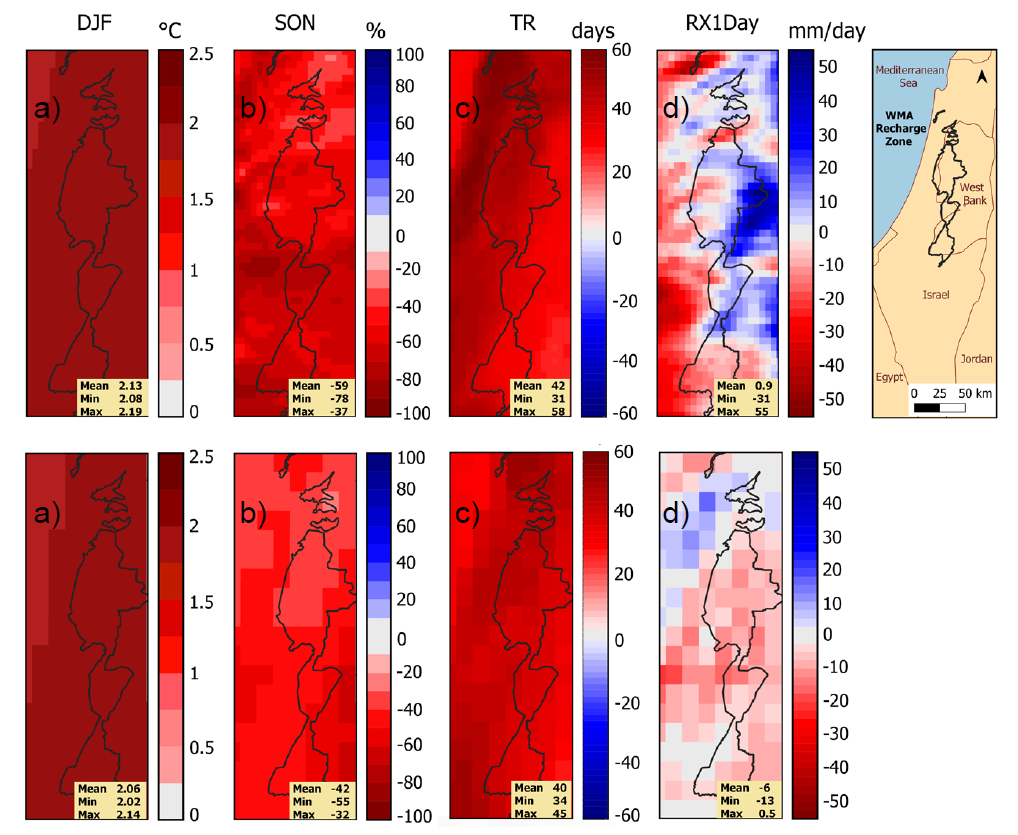
Investigations of potential climatic changes in the groundwater recharge zone could provide indications of an aquifer’s long-term recharge capacity. Here, we compare results from 3km and 8km climate projections until 2070 for the recharge zone of the karstic Western Mountain Aquifer (WMA) in Israel and the West Bank.
For 2041-2070, two sets of daily climate data (1981-2070, IPCC RCP4.5) with resolutions of 3km (ISR3) and 8km (ISR8) were used to determine indicators for seasonal climate change and extreme events and compared to a 1981-2010 period. Selected results are presented here.
The ISR3 and ISR8 data show differences in the distribution and magnitude of calculated values. Evaluation of the average seasonal temperatures shows a temperature increase of up to 2.2°C in winter and fall for the ISR3 and ISR8 data (Figure 1a). For the average precipitation, the ISR3 projection shows a significant precipitation decrease of up to 59% in the fall compared to 42% in the ISR8 projection (Figure 1b). Deviations are seen in the max. number of tropical nights (TR) with 58 days per year (ISR3) as opposed to 45 days (ISR8) in the northern part (Figure 1c). Large deviations between the ISR3 and ISR8 data occur for the max. daily precipitation (Rx1Day). Figure 1d shows a projected change in the max. value for RX1Day of 55 mm/day as opposed to 0.5 mm/day (ISR8).
Altogether, the ISR3 projection shows an even more accurate trend of climate change for indicators of temperature and precipitation and predicts extreme precipitation events not simulated in the ISR8 data. The changing future precipitation patterns, longer dry spells, and higher temperatures in the precipitation-rich months, with consequently higher evaporation rates, demonstrate the need for action. Using the projections as input for a SWAT model, we found that groundwater recharge of the WMA may decrease by up to 25% (ISR3) until 2070. The ISR8 projection results only in a 16% decrease, showing the high uncertainty of the model results.


